Digital & Insights

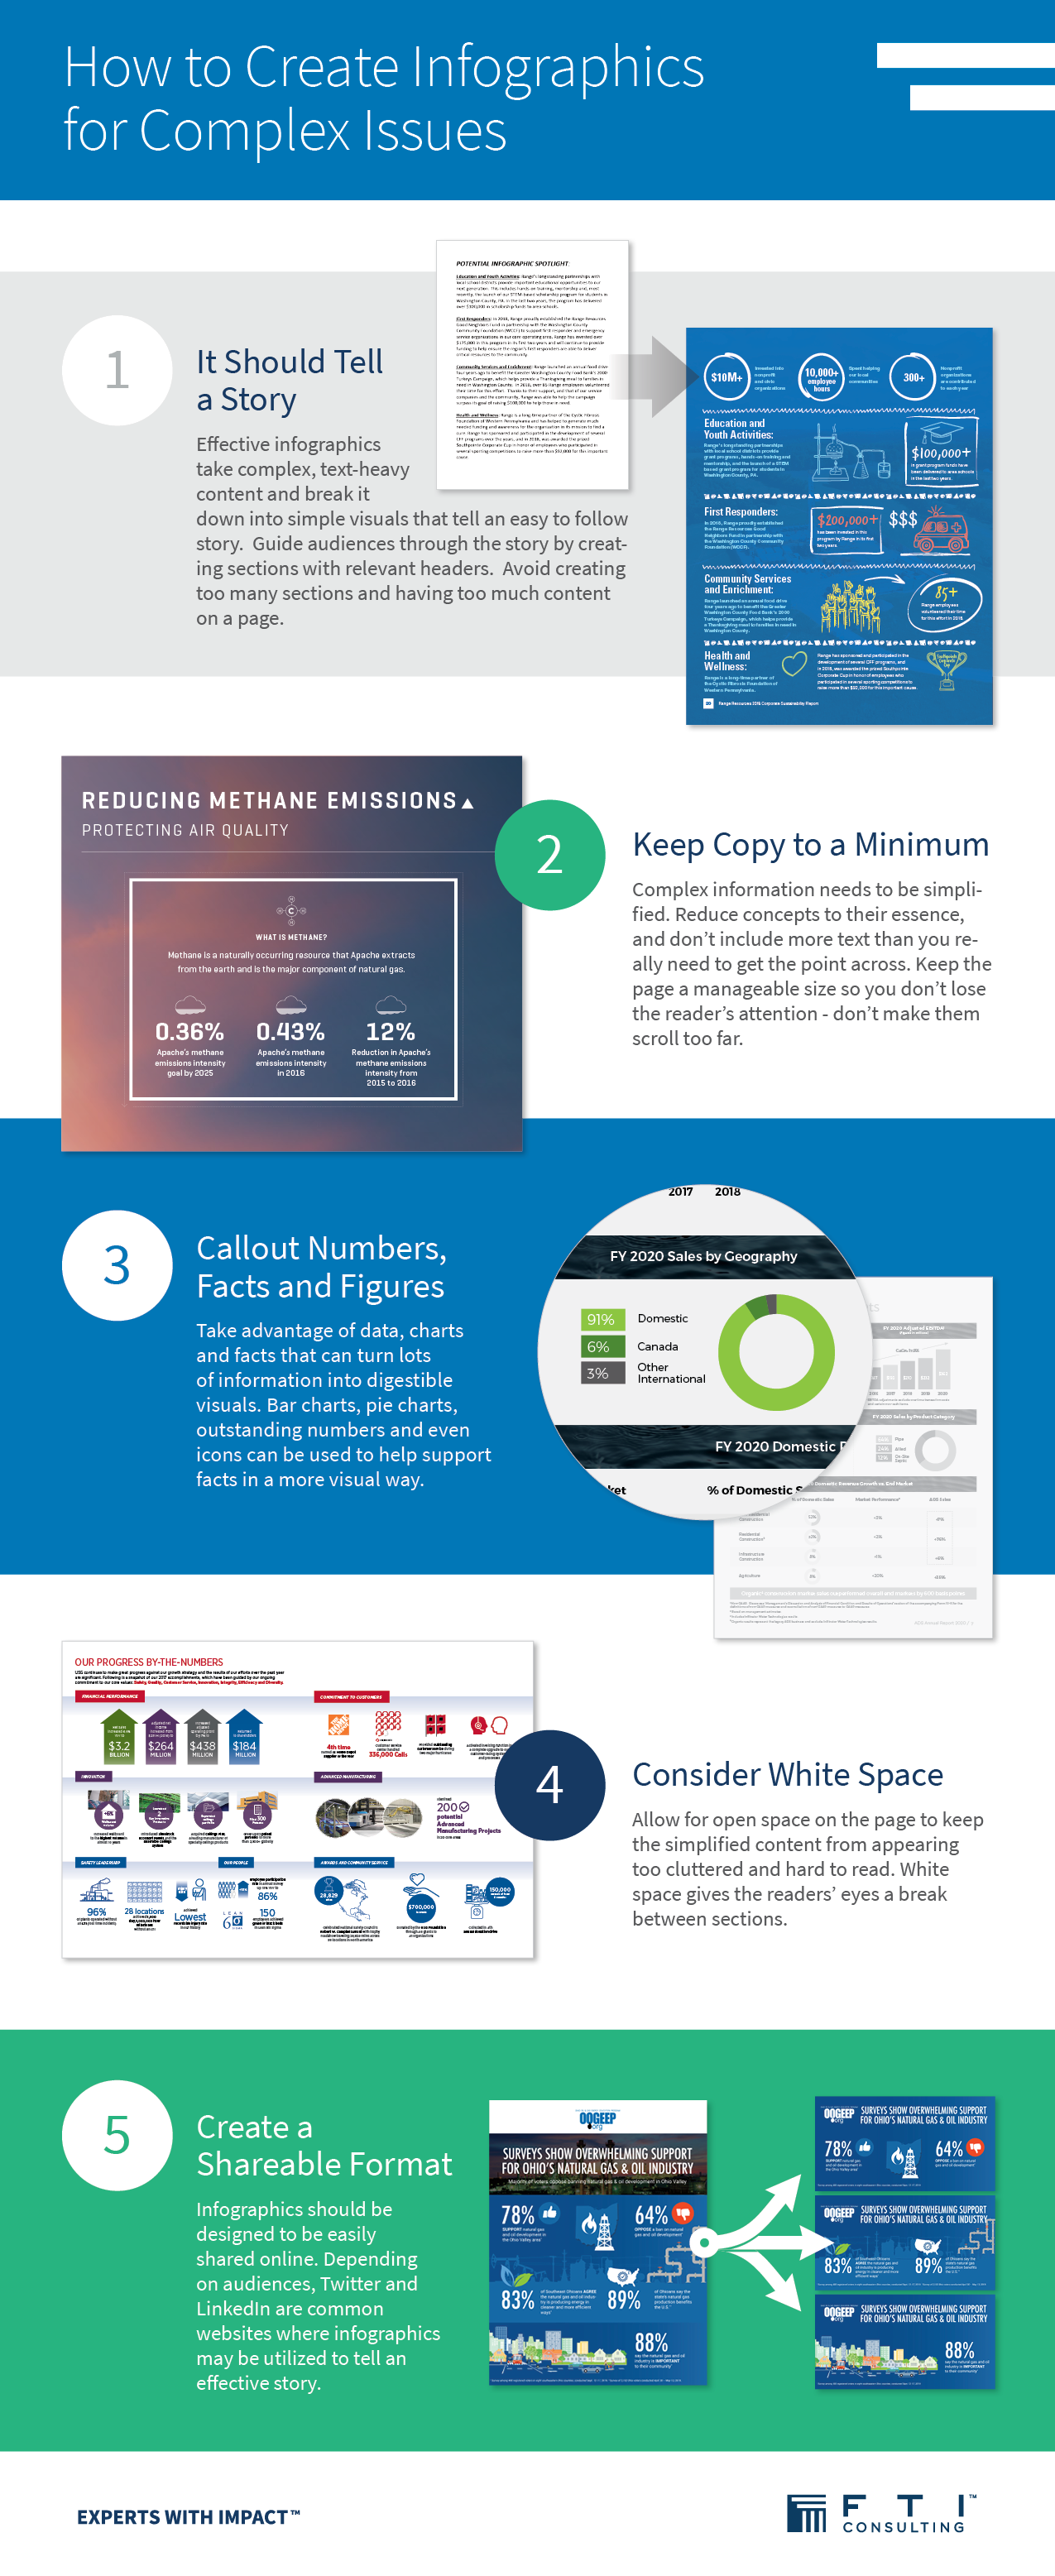
How to Create Infographics for Complex Issues

Thanks to computers, smartphones and shortening attention spans, we are seeing an explosion of visual content across the Internet. Infographics are a key tool in your creative toolbox for managing corporate reputations and telling complex stories. In fact, even though stock photos were used most frequently in marketing, 40.2 percent of marketers said that original graphics like infographics and illustrations actually performed the best of all visual formats.

What’s more, blog posts with a higher ratio of visuals engaged readers more, seeing higher average time spent on page and lower rates of people leaving pages. This infographic offers several key tips that will help you tell stories visually for our increasingly complex world.


Related Articles

4th Annual Shareholder Activism State of the Market

September 8, 2025—4th Annual Shareholder Activism State of the Market Request Report The 4th Annual Shareholder Activism State of the Mark...

Use It or Lose It: U.S. Hydrogen Industry Must Act To Maintain Momentum

July 12, 2025—Key takeaway: Following the passage of the “One Big Beautiful Bill Act”, time is of the essence for hydrogen produce...

Quick Analysis: ‘One Big Beautiful Bill’ Drives More Gas and Batteries, Less Renewables

July 3, 2025—With the recent passage of the “One Big Beautiful Bill” (“OBBB” or the “Legislation”),[1] FTI Consulting’s...

FTI Consulting News Bytes – 26 June 2026

June 26, 2026—FTI Consulting News Bytes Similar to the UK weather this week, things are heating up in the tech industry – here’s w...

Global Public Affairs Newswire – 26 June 2026

June 26, 2026—Welcome to the latest instalment of FTI Consulting’s fortnightly Global Public Affairs Newswire.  This week, we bring...

ESG+ Newsletter – 25 June 2026

June 26, 2026—We open this week’s ESG+ with a look at the growing momentum behind pass-through voting, as investor appetite and ...